Part characteristics and quality assurance
Part characteristics and quality assurance
Strong mechanical properties
Parts produced with L-PBF typically show a very fine, lamellar microstructure.
Parts produced with Laser Powder Bed Fusion typically have a high strength / stiffness compared to known values due to fast solidification process.
Parts produced with L-PBF typically show a relatively high density of >99,5% and often exceeds conventional processes such as casting.
Parts produced with L-PBF show a grainy, rough surface after printing. As a rule of thumb, the as-printed surface roughness is Rz: 80 – 140 µm and Ra: 5 – 15 µm.
Typical hardness values of Laser Powder Bed Fusion parts are higher than conventional alloys. This is driven by the fast cooling rate that leads to a fine microstructure.
The achievable accuracy of the L-PBF process depends several factor such as residual stresses, the build temperature and the suitability of the AM design. The typical geometric accuracy is ± 50 µm and typical dimensional accuracy < 3 % for prototypes or 100-500 µm during serial production.
The quality criteria of L-PBF parts can vary depending on the specific application and requirements of the part. In this section we have summarized some of the most common criteria and how to measure them.
What you will find in this section
Microstructure
L-PBF parts display a homogenous and fine-grain microstructure

Parts produced with L-PBF typically show a very fine, lamellar microstructure. Among other factors, this results from a very high cooling rate >1000 K/s. The upper picture on the left displays the typical columnar grain growth, in this case for printed Ti-6Al-4V. The typical grain size is several micrometers.
The lower picture indicates the actual layer height, in this case 30 µm. The melting depth of the laser exceeds the layer height, so each layer is melted multiple times.
The microstructure can be altered through heat treatment.

The layer orientation typically has a very small influence and L-PBF parts typically show no to very little anisotropy. Data and research often shows a minor influence on the static properties as can be seen in the picture on the left. Upright specimen (90 degrees) exhibit many more layers with possible bonding defects and thus favors failure. Additionally, insufficient melting and heat treatment favor anisotropic behavior of the material.
Tensile strength
Mechanical characteristics of L-PBF material

Parts produced with Laser Powder Bed Fusion typically have a high strength / stiffness compared to known values due to fast solidification process. The chart above shows a qualitative comparison of the yield strength and Elongation both as printed and after heat treatment. The ductility can generally be increased to known values by applying specific heat treatment (if desired). This typically causes a reduction of strength. Certain LPBF materials can show both higher strength and higher ductility
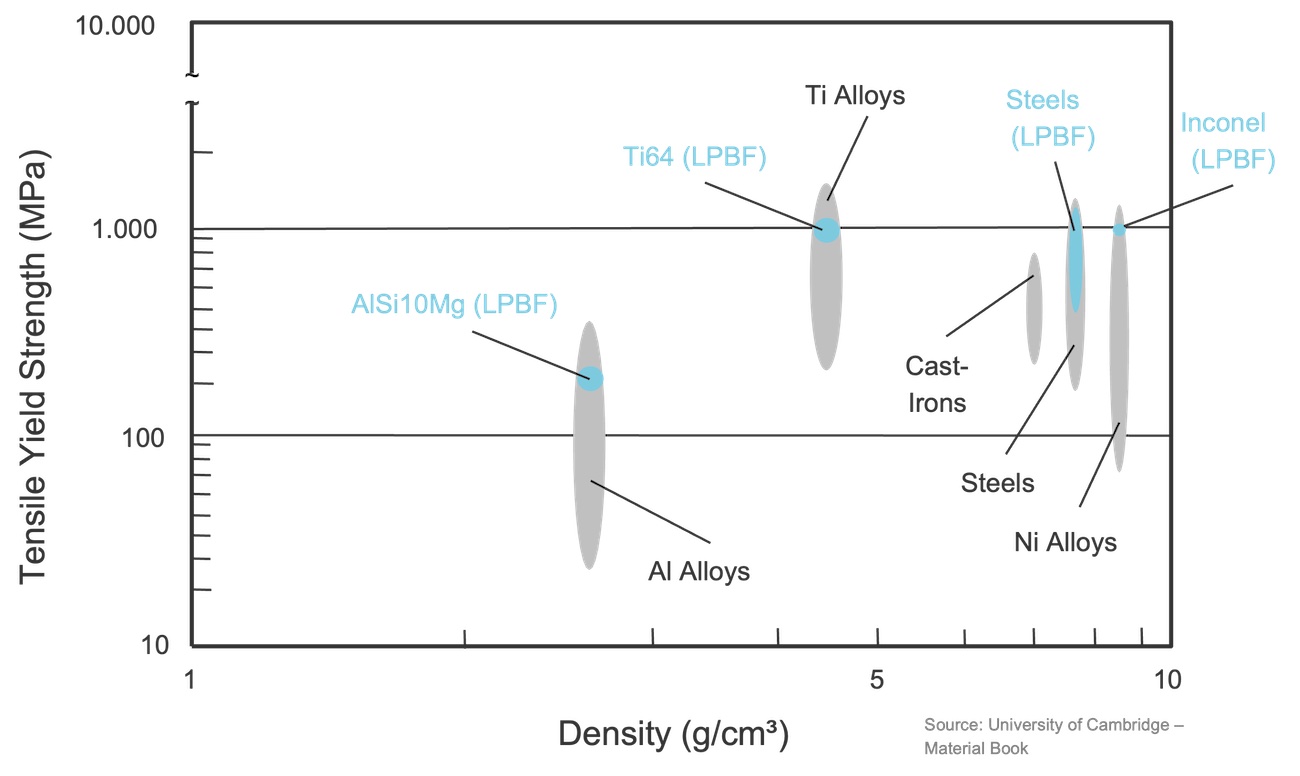
The chart on the left displays the tensile strength and density for different materials. It can be seen that the material properties that can be achieved with L-PBF are typically on the higher end compared to other production processes.
Porosity
L-PBF process typically results in high density parts

Parts produced with L-PBF typically show a relatively high density of >99,5% and often exceeds conventional processes such as casting. The density is influenced by the Volumetric Energy Density (VED) of the process parameter and must be optimized for the combination of machine, alloy and powder. Density is typically determined via the Archimedes principle or via light microscopy.
The Archimedes principle is a method for determining the density of an object by measuring its buoyancy in a fluid. A density cube is first weighed in a liquid followed by a weighing of the dried cube in air.
With Light microscopy, a polished sample is observed under a metallographic microscope. The density is then derived from a picture analysis.
Surface quality
L-PBF parts show grainy surface

Parts produced with L-PBF show a grainy, rough surface after printing. The graph above compares the typical surface roughness of several technologies. L-PBF typically lies between investment casting and forging. The achievable roughness strongly depends on the layer thickness, powder size, surface orientation, process parameters and focal diameter.
As a rule of thumb, the as-printed surface roughness is Rz: 80 – 140 µm and Ra: 5 – 15 µm. While different values can be achieved for different orientations, downward-facing surfaces usually display the highest roughness.
For small layer thicknesses, high process resolution in combination with small powder particle distribution results in a smoother surface. For the opposite, large layer thicknesses, low resolutions and coarse powder particles, a high surface roughness is expected. A high surface roughness can be desired in some cases, for example in medical applications, where it facilitates bone ingrowth.
The final part surface has a large impact on the functional properties and its use. Design considerations should not only be focused on the printing process. It also needs to be considered when it comes to decide on post-processing steps and how to perform these on the printed part. The as-built quality of the printing process influences the type and extent of post surface treatment.
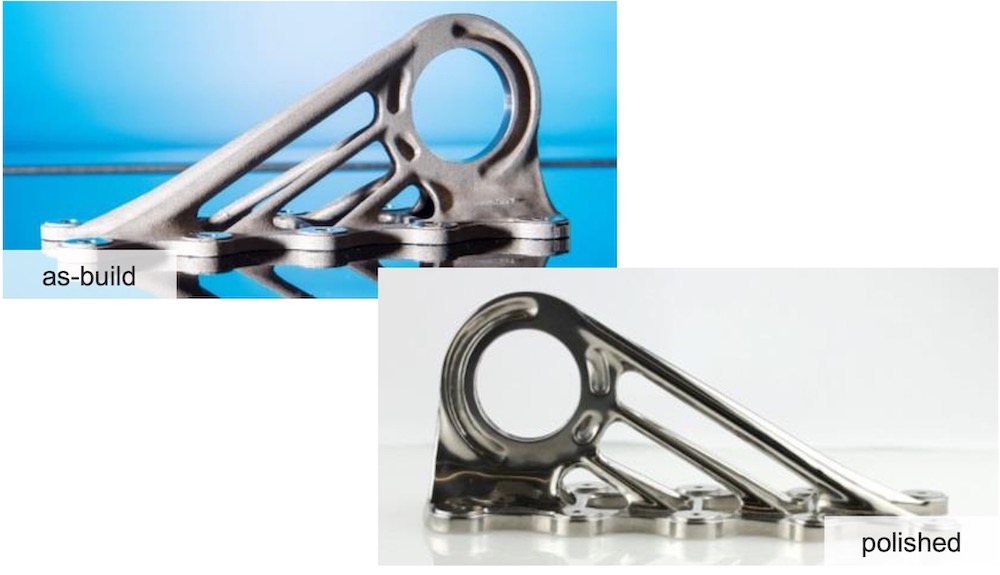
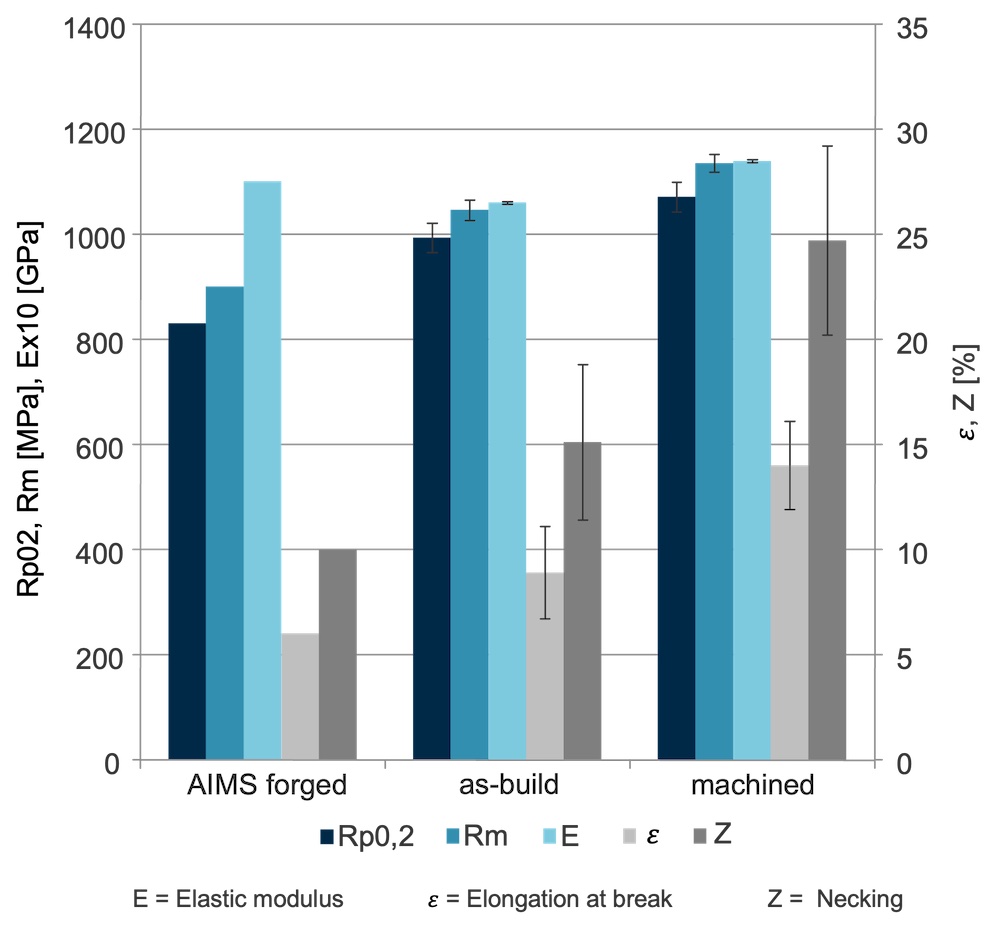
The chart on the right compares static mechanical properties of parts printed in Ti-Al6-V4 in forged, as build and machined condition. First it can be seen that both as printed and machined values exceed the properties that can be achieved with forging. Second, the as-build surface roughness has little influence on yield and ultimate tensile strength.
The elongation at break and reduction of the area reduces significantly due to high surface roughness.
Surface quality assessment
The grainy surface of printed components is a common challenge. Assessing the surface roughness is thus a common practice during quality assurance. Generally, this can be done either via tactile or conformal measurement.

Tactile measurement of surface roughness of involves using a probe or stylus to physically measure the surface of a part and quantify its roughness characteristics.
During the measurement process, the stylus is moved across the surface of the part in a controlled manner, and the resulting height data is recorded. The height data is then analyzed to determine various surface roughness parameters such as Ra (arithmetic average roughness), Rz (maximum peak-to-valley height), and Rt (total roughness).
Tactile measurement is easily available and is the most reconized method as of today. However, the main disadvantages are that complex surfaces might be hard to access and that it can lead to an imperfect representation of the profile.
Confocal measurement of surface roughness is a non-contact method that uses a confocal microscope to measure the surface of a part and quantify its roughness characteristics. During the measurement process, the confocal microscope scans the surface of the part with a laser beam and measures the reflected light.
The main advantage of confocal measurement is that it leads to a high resolution and does not require contact with the part. One of the downsides is that today it is rarely used and not widely available.It may also not be suitable for all applications, as it can be affected by factors such as surface reflectivity and the optical properties of the material being measured.

Hardness
L-PBF parts typically show higher hardness compared to conventional alloys

Typical hardness values of Laser Powder Bed Fusion parts are higher than conventional alloys. This is driven by the fast cooling rate that leads to a fine microstructure. The table displays the Vickers hardness for the most common L-PBF alloys in as printed condition. These values can be altered through heat treatment if desired.
Hardness is easy to measure using cubes that can be produced in the same build job together with the the actual parts. The cube is typically embedded in a resin, polished and then measured through the standard Vickers methodology.
Dimensional accuracy
Accuracy comparable to die casting and investment casting

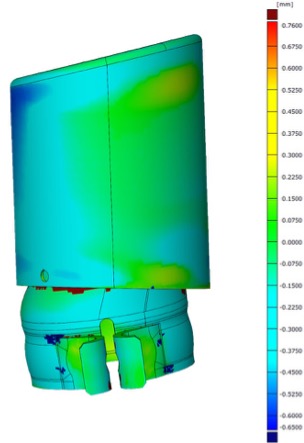
The achievable accuracy of the L-PBF process strongly depends on the distortion due to residual stresses, the build temperature and optimized shrinkage compensation as well as the suitability of the AM design. The distortion differs between materials, as a rule of thumb is small for aluminium, medium for steel and large for Ti-6Al-4V. The typical geometric accuracy is ± 50 µm and typical dimensional accuracy < 3 % for prototypes or 100-500 µm during serial production.
The dimensional accuracy can be measured with a variety of different tools, among them microscopy, CT-scaning or 3D-scanning.
In-process quality assurance
Efficient monitoring of the part quality
In-process quality assurance (QA) systems play a critical role in ensuring the quality and consistency of parts produced using L-PBF technology. These systems involve a set of procedures and protocols that are applied during the manufacturing process to ensure that the final product meets the required specifications and quality standards. Some of the failure types that in-process QA systems can identify are delamination, overheating, uneven powder distribution or wrong machine set-up.
The analysis and interpretation of the QA data is often still a manual process requiring deep expertise. More and more intelligent software is coming up, however, that promise to automate the QA process and potentially even perform corrective actions.
Global monitoring
On a global level, sensors are used to monitor the overall state of the L-PBF process. This includes the O2 content and pressure in the atmosphere and the laser current.
Compared to other monitoring systems, they have a low sampling rate and low resolution and thus lead to relatively small data packages.
Powder layer control


Powder layer control is an effective way to monitor the recoating during the L-PBF process that has become standard for most machine manufacturers. A picture of the powder bed is taken before and after the application of a new layer of powder and the applied powder is depicted as grey scale picture.
This way it can be analysed if powder is missing on a layer, e.g. because of poor powder quality or false machine settings, or if parts are bending up and are thus defective. Since such a system generates over 1 000 pictures for a typical build job, the analysis must be guided by intelligent software.
Melt pool monitoring
Melt pool monitoring provides the most in-depth analysis of the AM process. The systems include high speed CCD cameras that translate the electrical signals into digital values to measure the melt pool dimensions as well as diodes and a pyrometer to measure the melt pool intensity. Due to the high complexity, 2D or 3D mapping of the data is required for making the most out of the systems. The identification and correlation of abnormalities to defects remains extremely difficult, especially when building a part for the first time. Melt pool monitoring systems have a very high sampling rate and resolution and thus lead to very large data packages.

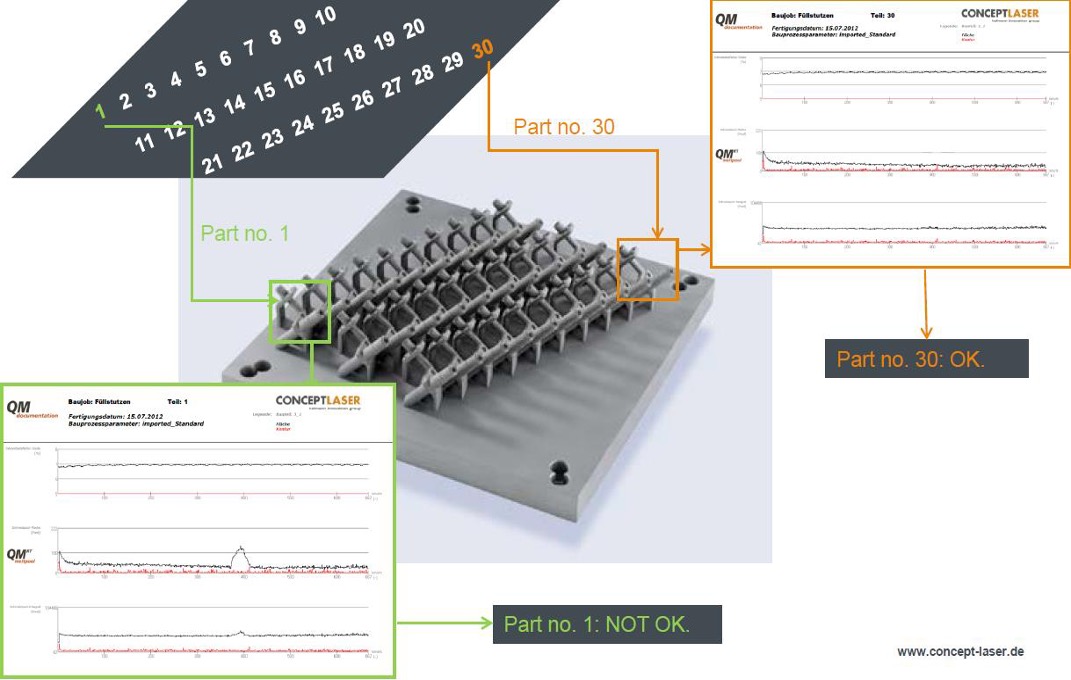
The picture above shows how melt pool monitoring can be used for quality assurance in the LPBF process. 30 identical parts are produced in the same build job, each using the exact same process parameters. The signals measuring the melt pool dimensions and intensity should thus be identical for all 30 parts. Part 1 shows a deviating signal at a certain point, indicating a process abnormality that could lead to a certain defect. This part should thus be either be directly rejected or analyzed in more detail, e.g. using a CT scan.